Custom Dashboards
Dashboards provide enhanced reporting capabilities. They enable users to chart, evaluate, and (in some cases) even change key business data. Custom dashboards provide greater visibility into reconciliation process.
Each dashboard can have a maximum of four views. This includes list views, pivot views, or chart views. You can open a maximum of 10 dashboards at a time. Service Administrators, or any user who is granted either the Operational Dashboards - Manage role or Dashboard - Manage role can create and edit dashboards. The dashboard creator can also control access to the dashboard by granting permissions to one or more users, groups, or teams. Users who have been granted access to a dashboard can run the dashboard and view its data. The access only allows a user to view the dashboard. It doesn't extend their access to the underlying data. Therefore, a user can only view records based on their own access within the service.
Features of Custom Dashboards
Dashboards provide the following features:
- Visualize data interactively with a wide variety of chart types
- Obtain both high-level and detailed insights into the performance of your reconciliations
- Create filters at the dashboard level and at the individual view level
Filters created at the dashboard level are applied to all the views within the dashboard. After this, filters defined at the view level (if any) are applied.
- Control access to viewing dashboards
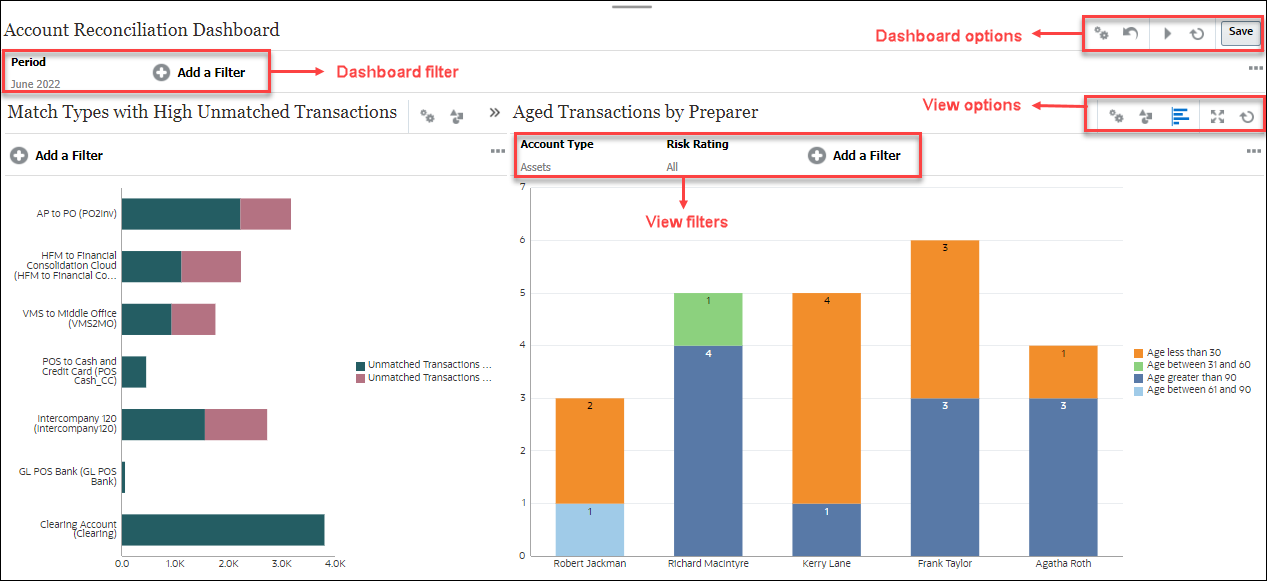
The design mode of a dashboard enables admin to configure and manage your dashboard and its components (chart views, list views, and pivot views).
This image shows the design mode of a custom dashboard that contains two chart views.

At the top-right are these options to manage the dashboard:
 Settings
Edit the properties of the dashboard.
 Revert
Revert changes made to the dashboard properties.
 Run
RunRun the dashboard.
Dynamically fetches and displays data in the dashboard. Only users who have been granted permissions can view the dashboard's data.
In Run mode, users will see only the Refresh and Expand options.
 Refresh
Refreshes the data displayed in the dashboard, including all the contained views.
 Save
SaveSaves the changes made to the dashboard properties.
Each view (list, chart, or pivot) within the dashboard contains these options:
 Settings
Edit the properties of the chart, list, or pivot view.
 Object Type
Options are: Reconciliation, Transactions, Alerts, Detail Balances, Profiles, and Matching.
 View Selector
Options are: Chart View, List View, or Pivot View.
 Expand
Displays the view in the entire dashboard area.
This option is shown only when a dashboard contains more than one view.
 Refresh
Refreshes the data displayed in the view.
Steps to Create dashboards:
1. From the Home page, click Dashboards, and then Custom. The Dashboards page appears,
with the list of existing dashboards.
2. Click the New icon. The new dashboard is opened in a new tab. It contains the following:
• A default name, in the format New Dashboard #.
• One empty view (list view, pivot view, or chart view)
• Two sets of icons (at the top-right) that correspond to the options for the dashboard and
the view within the dashboard.
• A filter for filtering data at the dashboard level. Click Add a Filter to add filters.
3. In the set of icons that correspond to the dashboard, click the Settings icon. The Edit
Dashboard dialog appears.
4. In the Properties tab, specify the required dashboard properties
5. Click the Access tab to give access to this dashboard for users, groups, or teams. Users who
are granted access can run this dashboard and view its data.
6. Click OK. A separate area, with its corresponding icons, is shown for each area specified by
the dashboard layout. For example, if you set Layout to Grid, the page shows four separate
areas.
7. For each area within the dashboard, set the object type based on which you want to
visualize the data.
8. For each area within the dashboard, click the select the View Selector icon and specify the
type of view.
9. For each view, click Settings and specify the settings for that view.
10. Click Save to save the dashboard settings.
Created by Mohit Jain and Megha Gupta


No comments:
Post a Comment